
How Do You Measure Up?
We’ve now written three articles on how Google views our industry for speed and performance. We first touched on Page Speed, Speed Index, SEO scores for OEMs (vs Independents) and then on Accessibility and Best Practices scores for the same group. Next, we looked at Google’s Speed Index scores for dealer website vendors. In this article, we will wrap up this four-part series with an analysis of how Google ranks website vendors for average SEO, Accessibility, and Best Practice scores. Remember, our data source is quite large pulling from over 35,000 dealer websites. No joke.
Average SEO Score
As everyone knows, technical SEO is a very important requirement for good website design. If your technical SEO is poor, then your site will behave like a one-legged man running a marathon.
The average SEO score for all vendors was 86%. Overall, this is pretty good and a sign that most vendors are getting their technical SEO right. This is in sharp contrast to our mobile Page Speed analysis where the performance was dismal. But let’s look at the data…
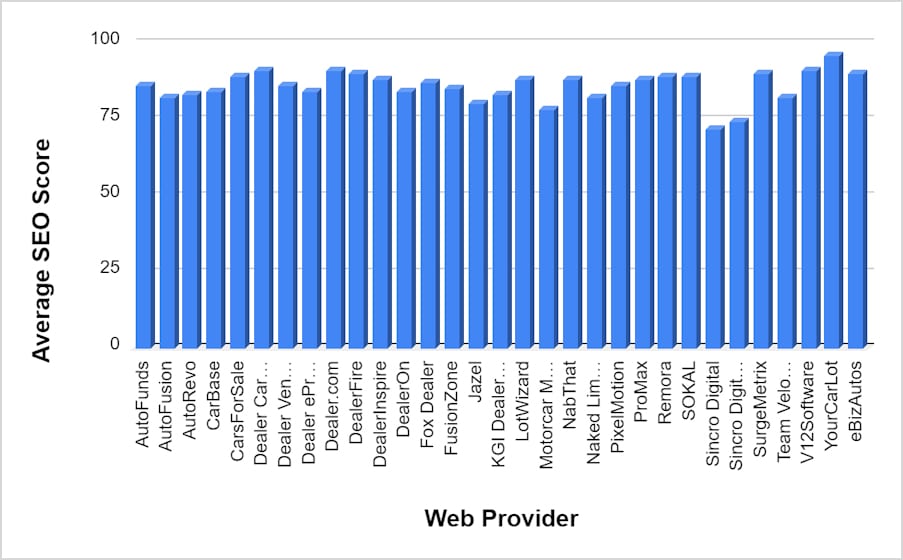
What does this bar graph tell us? The most obvious thing we see is that Sincro Digital has work to do and YourCarLot is doing slightly better than most.
Average Accessibility Score
What is Accessibility and why is it important? Google’s Accessibility audit/score is rooted in the Americans with Disabilities Act (ADA). The ADA is a civil rights law that “prohibits discrimination against individuals with disabilities in all areas of public life, including jobs, schools, transportation, and all public and private places that are open to the general public.” What does that mean for web providers? Simply put, websites need to be designed in such a way that they can be easy to “read” whether by adjusting sizes, maintaining strong contrasts, and/or by allowing digital readers to “read” the website out loud for someone with a severe visual impairment.Google’s Accessibility Score weighs the average of a number of accessibility audits to create the score that you see. These scores are important because if you have a low score, you are not serving your customers well AND you are possibly exposing your dealership to a lawsuit by an enterprising lawyer or two. Enough with that. On with the data:
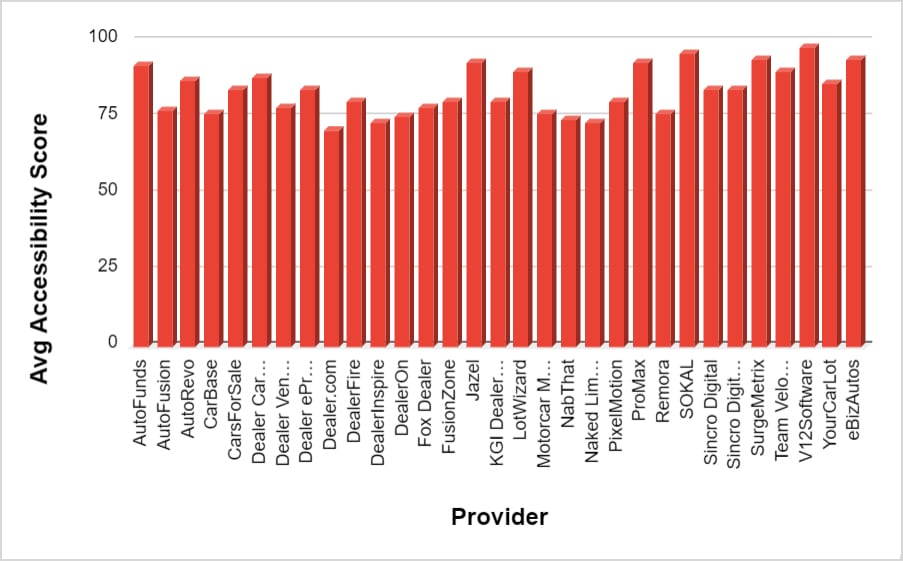
By and large, these results are good, but as you can see some providers, such as Naked Lime and Dealer.com average below 75%. Realistically, the average should be higher and technical and design adjustments to the website can improve performance. I would recommend that any provider who is below at least 85% should seek to improve their positioning. Otherwise, they are risking causing trouble for their dealers. That said, kudos to those website vendors 90% and above such as AutoFunds, Jazel, LotWizard, ProMax, SOKAL, V12, Team Velocity, eBizAutos and SurgeMetrix.
Average Best Practices Score
Your Best Practices score is based on an audit of common web development mistakes, some of which serve as the root cause of scoring deductions for other scores such as those above.
A poor score here is very avoidable so the overall vendor average of 75% is something to decry and not celebrate. Realistically, you should score over 90%, but like I said above, 85% or higher is a good start. Here’s some data-driven eye candy since a “picture”, or in this case a graph, is worth 1,000 words.
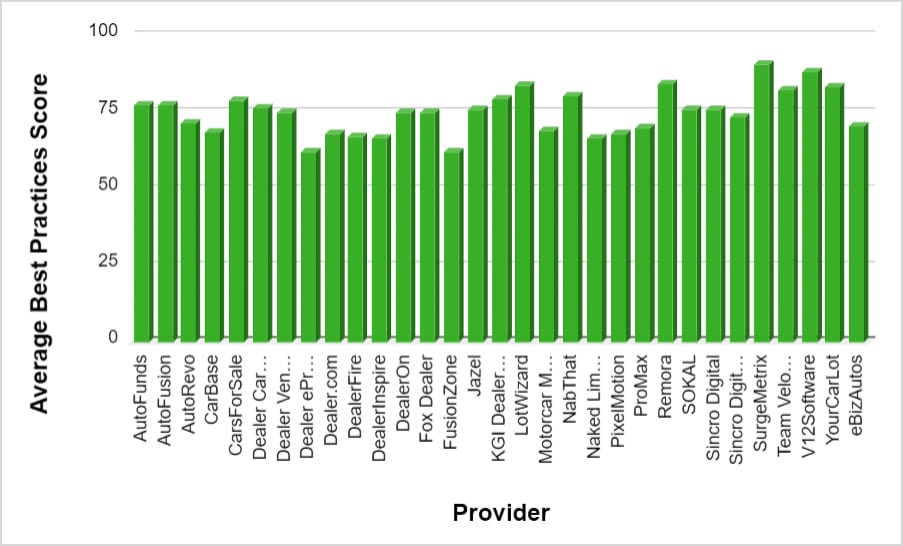
As you can see from the data, most website vendors hover around the 75% mark with some, such as CarBase, Dealer eProcess, Dealer.com, DealerFire, DealerInspire, FusionZone, Motorcar Marketing, Naked Lime, and PixelMotion all scoring in the 60s.
Sadly, there are only two website vendors above 85%: V12Software at 88% and SurgeMetrix at 91%.
The Final Word
While Brian Pasch drives conversation around GA4 standards for the dealer community, we need to have the same standards discussion for website vendors as I suggested in my last article. Some standards are pretty obvious. For example, since we know that bounce rates increase dramatically the slower a website loads, we should set our speed standards according to user behavior. 3 seconds is a good goal for mobile sites although 4 is fine to start. In the case of the stats above, it is not hard to reach 90% for a performance goal for all three measures. We can do better.
If anyone wants to discuss the data we collected, have opinions and suggestions for standards, or want their site (and even their competitor’s sites) evaluated, then contact me via email or 954.507.6468. Until then, use this data to push for better performance. You deserve it.