
by Adam Dennis, David Kain, and Tom Kline
Pull up your average dealer website and you typically find a bunch of stuff besides the core content and inventory:
- A slider with multiple promotions that load every few seconds.
- A range of calls to action (CTAs) across the home page, with many treated equally whether they are important or not.
- A boat load of third party tools or scripts that are activated when the page loads. Some are invisible (such as tracking pixels) while others are embedded into the page providing various functionality.
- Video which shows activity at the dealership, a car driving down the highway, you name it.
- Or popups that can include anything from the latest promotion to content about COVID.
But you have to ask yourself: Is all of this stuff worth it, or does it hurt the overall performance of my website, and thus hurt my bottom line?
Why Do You Have a Website?
Let’s look at why you have a website. What is its core purpose and does your website serve that purpose? If you are a car dealer, then your primary objective is to sell vehicles. If you have a service bay, then your secondary purpose is to keep it full at all times. Finally, other sources of revenue, such as your body shop, parts department and F&I, will get included as part of your offering.
Let’s be clear: Unless someone can convince us otherwise, the primary purpose of your website is to sell vehicles and keep your service bay full, if you have one. This should guide all of your decisions about your website and influence you to avoid things that will blunt that purpose.
What’s Important?
If we agree about the primary purpose of your dealer website, then we should now look at what’s important to ensuring that that purpose is fulfilled at every opportunity.
Here are 5 things you should optimize for your website to optimally perform:
Speed.
No joke. The slower your site is, the more money you will waste. You want your mobile and desktop versions of your website to load quickly at all times. As far back as 2012, Amazon was reporting that the slower the page load, the more money they would lose. A Fast Company article in March of that year discussed how Amazon calculated that a page load slowdown of just one second could cost it $1.6 billion in sales each year. That was over 8 years ago. The need for speed was important then, and even more so now, with the vast majority of people using their cell phones to shop online. Read on and you will see our findings for study that we recently did with some of our customers on the importance of having a fast website. The results are promising for those who recognize that fast websites make money.
SEO Rating
As Google expands the available space it uses for paid content, it is getting harder and harder for anyone to get on page one of a search. This makes it even more important to take care of your SEO fundamentals:
- Keep your content fresh and relevant.
- Make sure your site has all of the technical components Google wants to see. (This requirement can get into the weeds and will be the topic of a future article.)
- Ensure that your site loads as quickly as possible.
- Make sure that you are optimizing your Google My Business listing by updating your content and maintaining your Google reviews above a 4/5. (While this last item might seem disconnected because it is not actually your website, a well optimized GMB profile is critical for driving traffic to your site and calls to your dealership. Think of it as a form of modern SEO that is getting more important every day.)
Google Performance
Truthfully, if you focused on how your website behaves from Google’s point of view, then you would be in a good position to ensure that your website is fast and your SEO rating is solid. One of the simplest ways to monitor your site’s performance is to use Google’s Lighthouse app. If you have Chrome, then just go here to grab the Chrome extension. Once the extension is loaded, visit your site and then tap on the extensions icon in the top right of your Chrome window and select Lighthouse. When you do this, Lighthouse will analyze your website and give you a report on the mobile and desktop speed of your website along with ratings on its accessibility, SEO performance, and best practices. All ratings are based on a scale of 100.
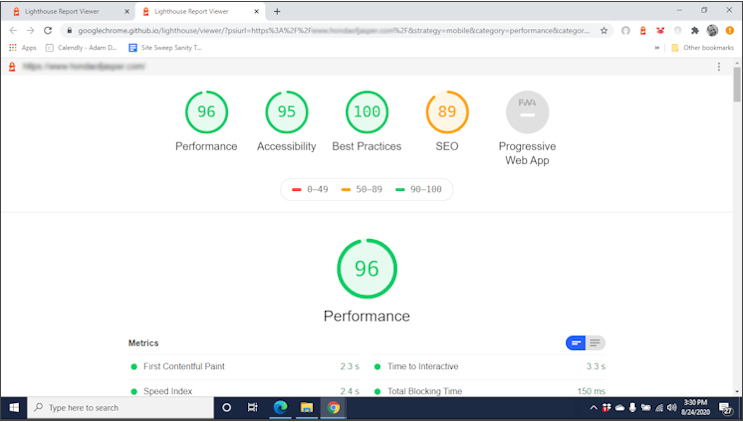
Here is what the main dashboard of a Lighthouse report looks like when your site is running well. Not bad when you focus on doing things correctly. But doing things right is not always easy when you have content clutter and third party APIs (…think little programs that talk with each other) that slow down performance.
A Good Example:
This example shows great marks across the board, the most important of which is the page load performance of 96/100. This means the site loads within 2-3 seconds, which is uncommon for most dealer websites..
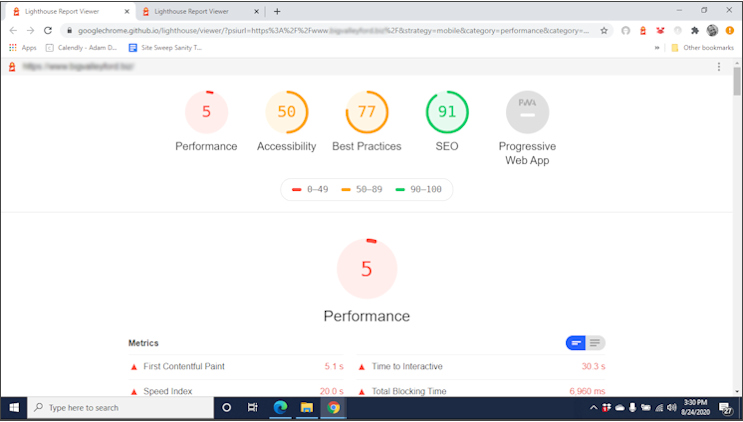
An Example That Should Worry You:
The 5/100 performance means that the site takes a very long time to load. Suffice it to say, you don’t want this rating because your bounce rate and leads will suffer.
CTAs with Minimal Distractions
For his 2003 Ted Talk, marketing master Seth Godin said that in a world where we have too many choices and too little time, the obvious thing to do is just ignore stuff.
This logic is as true today as it was 17 years ago. In order to get your customers to do what you want them to do (look at vehicles), you need to:
- Understand your shoppers
- Prioritize your Calls-to-Action
- Use clear, concise language that your customers understand (e.g. – New Vehicles instead of New Inventory)
- Make the Calls-to-Action stand out from their surroundings
- Limit motion, video, animation, and bright colors, except for the Calls-to-Action
- Limit the number of options that a shopper will see on their device at a given time…
- And test, test, test (or, more accurately, ask your provider to test and verify)
If you are feeling adventurous, you should read this article by CrazyEgg.com about CTA best practices. It’s a long read, but it is packed with information that is relevant to the CTAs on your dealer website.
Usability
We’re sure that you have had the experience where you visit a website and the information is provided like that artist from the 70s who would throw paint at a wall and call it art. The information is jumbled and hard to understand.
Thus enters the concept of usability, or “ease-of-use”. The point of a usable site is that a shopper can quickly figure out what to do without experiencing much mental friction (Think of mental friction in the context of not having to think. Your site should make it easy for your potential customers to do what you want. Check out Steve Krug’s book “Don’t Make Me Think” for more info on this subject.).
So let’s try this out. Pull up your website on your device. Can you quickly understand what to do if you are searching for a car or looking for service? Have you asked your customers these questions? Have you asked them if they could navigate your website to find what they needed with little effort? Have you tested your site with a tool such as Hotjar to see what people do when they visit your site.
Talk with your vendor and ask them to run a test using Hotjar or a similar tool. We do it all the time so it shouldn’t cause any pain, but it will give you information that you can use to improve how easily people use your site, find what they need, and submit a lead.
The State of the Industry
Now that we’ve done a cursory review of what you should be doing, let’s take a look at what’s actually happening in the industry.
We built an app called Recon that we use to profile dealerships. Using Google’s API, Recon reports on how Google rates the website’s four key performance parameters (Speed, Accessibility, SEO, and Best Practices) on a scale of 1 to 100. We do this so that we can provide customers with an authoritative benchmark for their website as we help them improve their website’s performance.
Earlier this summer we did a series of nationwide searches using Recon to look at how Independent and Franchise dealer websites performed. We surveyed OEM sites in particular along with key vendors certified by the OEMs.
Suffice it to say, the results were not good, and in some cases downright horrible. Our Recon app crawled and analyzed over 9,800 dealer websites and discovered that the average mobile site speed rating by Google was 13/100. Yes, that’s correct, 13/100! And, in the case of one domestic OEM, the average site speed was 10/100.
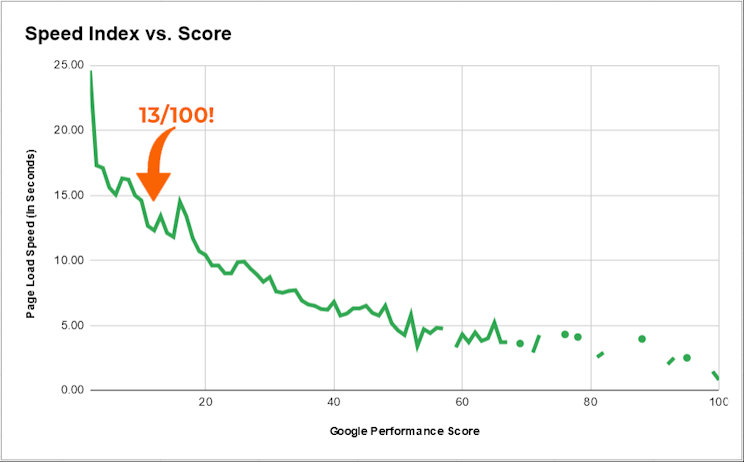
Think about it: an average of 13/100 for almost 10,000 websites! Now some might tell you that Google’s ranking system is inaccurate or irrelevant, but as you will see from our case study below, this is simply not true. A rating of 13/100, according to Google, represents a Speed Index of about 13.40 seconds (for the site to fully load)! From our experience, however, there is wiggle room by a few seconds each way… but does that really matter if the load time is that far above the goal of 2-4 seconds? We don’t think so. Other data from Google shows that as load time increases from 1-10 seconds, the bounce rate increases by 123%. For those who want a metaphor, a bounce is like a shopper walking up to your showroom door and then quickly walking away. Not good.
A Brief Case Study
We decided to test our philosophy by putting our websites on the line. Our hypothesis was simple: sites that have a good Google speed index rating of 80/100 or above, should have lower bounce rates, more sessions, and more leads.
We took a small group of dealers and focused on cleaning up their websites (while at the same time walking the tightrope of meeting all OEM compliance requirements).
When we took over these customers in March of 2019, Google ranked them in the 20s and 30s (out of 100). Over the year, we cleaned up site performance on Google ending with only one in the 70s, most in the 80s and one in the 90s. Improving the one in the 70s was limited by third party tools that slowed down the load time. That’s a conversation for another article…
What we discovered was that our hypothesis, however simple, was correct. For the sampling of sites we studied, we found that:
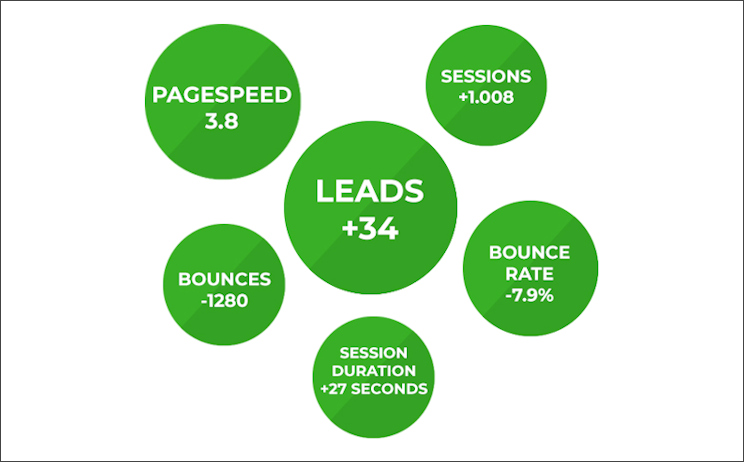
- Our average mobile page load speed was nearly cut in half from about 8 seconds to 3.8 seconds.
- Average sessions increased by over 1,000/month and the average session duration increased by 27 seconds/user.
- Bounces decreased by 1,280/month and the overall average bounce rate decreased by almost 8%.
- And, finally and most importantly, average leads/month increased by 34!
Think about it: an increase of 34 digital leads/month for free. That’s over 400 more leads/year! What would you do with an extra 400 leads/year, especially during this unpredictable time?
A Shift in Priorities?
Now let’s have a difficult conversation. Why is the average mobile speed so slow across the industry? This is a mind boggler of a question if you really think about it.
The extra work required to make sure your website performs well for Google and your digital shoppers is nothing to you, and really not that much for your provider. It just takes focus to correct the problems and adjust the code to make things hum.
Why is it so rare that dealer websites do well against Google’s benchmarks? Is it that Google’s algorithms are bad and the results are irrelevant so vendors ignore them? No. When we tested the sites in our sample, we didn’t just use Google, but also tested manually to validate the load times. There were variations, no doubt. We’re not doing perfect science here, but from our results it was clear that Google – on average – wasn’t that far off the mark.
So what is it? Part of the problem may be that there has been an unexpected outcome in the certified provider model for OEMs. When vendors work as a certified provider for an OEM that puts their 1-to-1 commitment to the dealer in a conflict with their commitment to the OEM relationship. They have two masters with the bigger one really writing the check. This might create a conflict where satisfying what the OEM prioritizes, and serving thousands of customers as efficiently as possible, is more important than making sure fundamentals are covered for the dealer.
If this is true, then the OEMs might want to step back and seriously consider their priorities. It would be wise for OEMs to follow Amazon’s example and stress speed as a top priority. Speed is money. It is that simple. As we showed above, there are more core KPIs (Key Performance Indicators), we’ll end with that point to keep this discussion short and to the point.
Conclusion
This was probably the simplest, but most profound, article that we’ve written to date. The simplicity is in the view that fast websites are a prerequisite for success. What makes this idea profound is that most web providers ignore it, or in a few cases that we found, even fudge the data by providing questionable results when their websites detect a Google scan.
Your dealer website is your primary vehicle for getting customers into your dealership. Don’t you think that it should meet simple fundamentals such as a fast load time on desktops, and most critically, on mobile phones? You don’t need to be fanatic about it. A 2 second load time is fantastic, but 3-4 seconds are fine as long as the user perceives that the site is quickly loading in front of their eyes as they look at their screen.
So, our advice is to load Lighthouse on your Chrome browser, do some tests, and then talk with your vendor to see how they might improve the performance of your site starting with speed and then going through the other items covered above. You have nothing to lose, and only leads and customer satisfaction to gain.
Feel free to contact us at any time if you want us to run a Recon Report on your site. Besides the Google performance data, we can also provide you with Google My Business results and a range of data on the volume and characteristics of the Hispanic population around your dealership. (Again, another point that is best covered in a separate article.)
Thanks for taking the time to read the article and best of success during these crazy times!
Adam Dennis, SurgeMetrix | David Kain, Kain Automotive | Tom Kline, Better Vantage Point